One thing that really boggles my mind is how quickly the world has changed. Yes, I remember when computers were slowly becoming the norm in the home and at schools. In school, we had designated times when we could go to the computer lab and learn how to type (thanks, Mavis Beacon), play with Logo programming (the cute little turtle you bossed around by telling it how to move around the screen), and then try to traverse the US in a wagon trying not to die from dysentery (we miss you, Oregon Trail).
But, my, how things have changed! No longer do we have to deal with floppy disks or green code-like text on a black screen. Instead, we tend to be faced with TOO much! Different sites fighting for our attention, people sharing their lives on social media, online shopping, and more – and all of these things contribute to the vast collection of data (of BIG data) that we don’t quite know what to do with. And, yet, some of these sites (you have to dig around to find them, sometimes) focus on teaching ANYONE how to become more self-motivated, how to work with big data, and how to still be creative and inventive in a world where knowledge is just a click away.
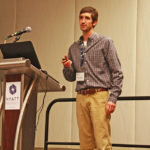
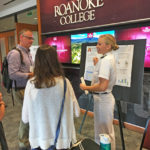
Kaggle is one such site – and it’s a site I hadn’t heard of until recently, from a student! Kaggle advertises itself as “the home of data science and machine learning” and “helps you learn, work, and play.” This Roanoke College student, Michael Johnson, is a junior Spanish and Math major. He says,
“Kaggle was kind of an accidental discovery for me. I was in STAT 302 [(Statistical Methods)] and we were being taught how to use R [(statistical software)] alongside the normal material. I had never really done any programming before, so I knew the only way I was going to learn it was to sit down with it and figure it out. I stumbled upon Kaggle, searching for datasets to use with R and kind of got to see how everyone else was using it to solve these complex, layered, and sometimes vague/open-ended problems.”
Accidental discoveries for the win!! Michael learned that Kaggle hosts competitions – as of today there are 17 active competitions, some of which offer monetary prizes! One that caught Michael’s eye was focused on using housing data from Zillow to predict home sale prices using more advanced regression techniques. Besides the main competition, there was also a more focused competition in which Kaggle would award $500 to authors of quality kernels (aka scripts). Noting that the current submissions didn’t seem all that involved, Michael thought that he could write something as good or better.
“I didn’t really expect to win, but I figured I had a higher chance attempting the $500 version than entering the main competition and squaring off with grad students and people who had PhD’s in stats/machine learning/etc. The dataset was massive, so I decided to scale it back to something that I could understand a bit more by focusing only on data from Virginia from 2010 onwards (the data pre-2010 was sparse). First, I demonstrated how to plot time-series data using a package called ggplot as well as how to apply a theme to the plots. Then I decided to try a very familiar, basic form of machine learning that I believed to be accessible to most people: linear regression. Essentially, I demonstrated that there was a linear relationship between the number of days a home spent on Zillow and its median sold price.”
“From that, we are able to make predictions on a home’s value using the regression line. Since it was simple linear regression, it was nowhere near the level of other posts and I posted it and kind of forgot about it. I was informed a few weeks later that my kernel was chosen as the winner for that week, and I didn’t really believe it. But I was chosen! And the money went into my bank account so I can confirm it was not a scam.”

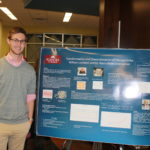
Congratulations, Michael! Just by trying to learn something new (how to program in R), he ended up using creativity and perseverance (and tools from his statistics courses) to analyze data and come up with a way to predict house sale prices! Want to see his script? Check it out here!
I asked Michael what his future goals might be, and he said,
“I never really knew what I wanted to do with my math degree until I found Kaggle and stumbled into the data science field. My plan right now is to build my skills in statistics and programming with the eventual goal of becoming a data scientist. Grad school may be on the horizon, which I had never really thought about before either.”
Michael, we will definitely be encouraging you to attend graduate school! We need minds like yours in the field of data science! I guess we should also say, thanks to Dr. Childers for utilizing R in statistics courses at Roanoke – for encouraging students who may have never seen programming before to use it in a context they may not have ever expected.
Could you ever have imagined a site like this would exist? It’s a wonderful opportunity for anyone to experiment with data and see what we can learn from it!
Congrats, again, Michael!